Iceland Statistics
Iceland Statistics Expanded Info
NTI Statistics Expanded Info
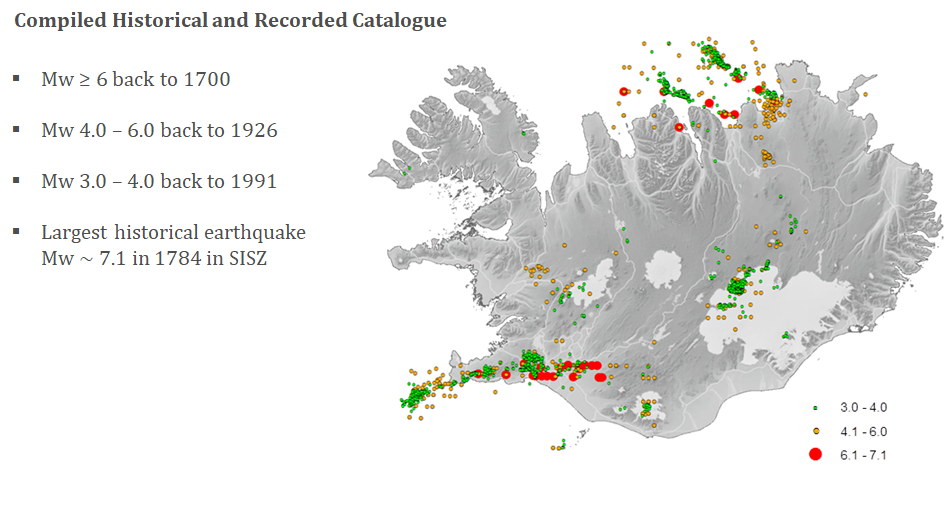
Seismicity of Iceland
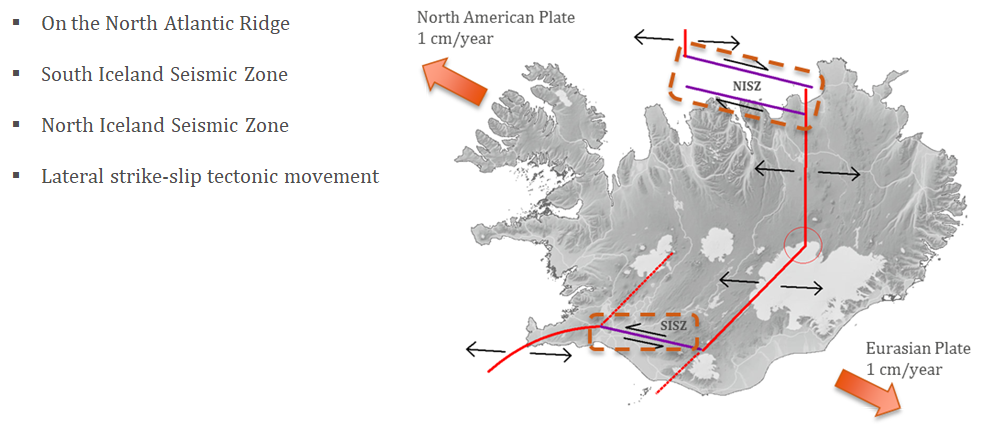
Seismicity of Iceland
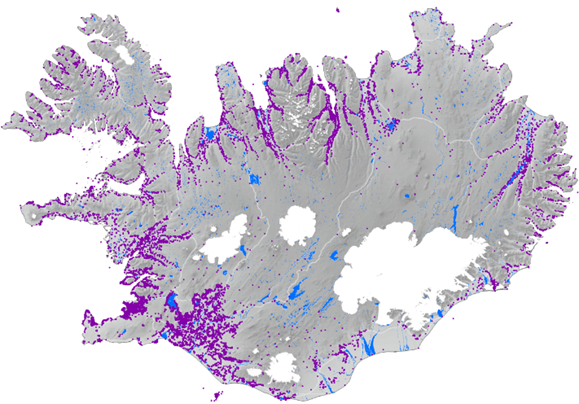
High-resolution Exposure Data (approximately 400,000 active insurance contracts)
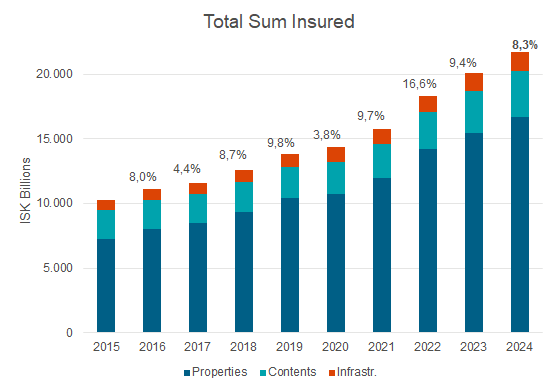
Total sum insured (2015-2024)
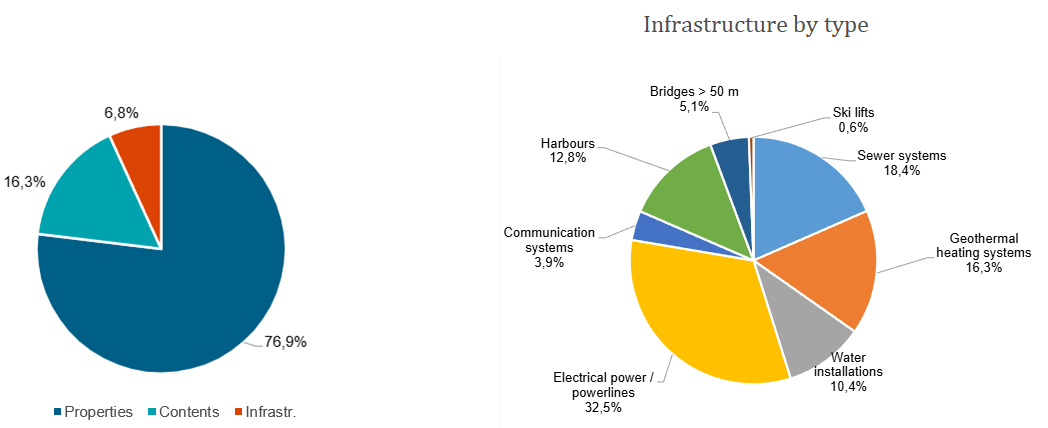
Sum insured by type
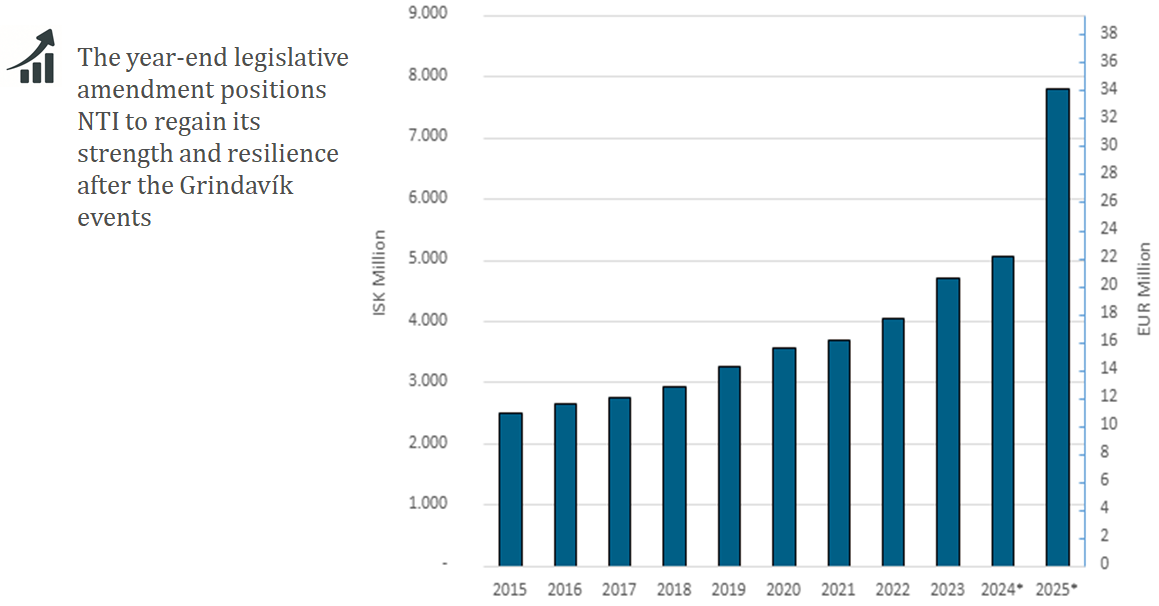
Premium income 2015-2025